FreeBSD. Installing and Configuring Nagios Monitoring

It’s time to explain how easy it is to set up a monitoring system for your hosts and services, configure notifications by email and SMS, and write your own plugin to check other services not covered by the plugins bundled with Nagios.
Nagios (IPA: nɑˊgɪos) is an open-source program for monitoring computer systems and networks. It is designed to observe and check the status of computing nodes and services, and notifies the administrator if any services stop (or resume) working. http://ru.wikipedia.org/wiki/Nagios
Besides Nagios, this category of software (monitoring Unix-like systems) includes:
- Monit and Supervisord—although these are geared more toward automation (automatic restarts, shutdowns, and so on in response to detected conditions);
- Zabbix—a powerful all-in-one tool that does just about everything (monitoring, notifications, data collection, and graphs). I’ll try to cover Zabbix2 in more detail in other articles, especially since I already have a draft;
- Munin (which I also plan to cover soon), Cacti, Collectd—for collecting system data (including graphs).
At one time or another, I’ve worked with all of them, but Nagios was my favorite as a monitoring and notification system. Easy configuration, a convenient and simple interface, and the ease of writing plugins all contributed to my choice.
FYI: This article was written in 2011, but I only found the energy to update and check it now (January 2013).
The version of Nagios discussed here is 3.4.1.
A Quick Reference to States and Notification Options
Nagios has the following states, used in the host.notification_options and contact.host_notification_options directives:
- d (DOWN)—notify when the host goes down;
- u (UNREACHABLE)—notify when the host is unreachable (for example, because of blocking firewall rules);
- r (RECOVERIES)—notify when the host returns to OK (the UP state);
- f (FLAPPING)—notify when the host alternates between being available and unavailable, i.e. flapping;
- s (SCHEDULED DOWNTIME)—notify when scheduled downtime starts and ends;
- n (NONE)—do not notify at all.
Nagios has the following states, used in the service.notification_options and contact.service_notification_options directives:
- w (WARNING)—notify when the service returns WARNING, meaning it is in a questionable state (see the plugin’s implementation for details);
- u (UNKNOWN)—notify when the service returns an unknown state (see the plugin’s implementation for details);
- c (CRITICAL)—notify when the service returns CRITICAL, meaning it is most likely broken (see the plugin’s implementation for details);
- r (RECOVERIES)—notify when the service returns to OK (the UP state);
- f (FLAPPING)—notify when the service alternates between being available and unavailable, i.e. flapping;
- s (SCHEDULED DOWNTIME)—notify when scheduled downtime for the service starts and ends;
- n (NONE)—do not notify at all.
In some other directives, you may come across the following options:
- o (OK/UP)—the service/host is up and working correctly;
- p (PENDING)—the host/service has not yet been processed by monitoring; most likely, it has just been added and Nagios has not started processing it yet,
Documentation for all directives, states, and options can be found here.
Installation on FreeBSD
Install Nagios from ports:
# Обновляем дерево портов
cd /usr/ports
portsnap fetch update
# Ставим Nagios
cd /usr/ports/net-mgmt/nagios
make install clean
echo 'nagios_enable="YES"' >> /etc/rc.conf
To handle PHP (part of the Nagios interface is written in PHP), install php-fpm:
cd /usr/ports/lang/php5
make deinstall clean && make distclean
make config
# Выбираем FPM
make install clean
To handle CGI (the other part of the interface), install fcgiwrap:
cd /usr/ports/www/fcgiwrap/
make install clean
Configuring Nagios
Now let’s start configuring it by copying the configuration files for editing:
cd /usr/local/etc/nagios/
cp cgi.cfg-sample cgi.cfg
cp resource.cfg-sample resource.cfg
cp nagios.cfg-sample nagios.cfg

cd objects
cp contacts.cfg-sample contacts.cfg
cp localhost.cfg-sample localhost.cfg
cp templates.cfg-sample templates.cfg
cp commands.cfg-sample commands.cfg
cp timeperiods.cfg-sample timeperiods.cfg
From here on, I’ll give paths relative to /usr/local/etc/nagios; for example, objects/contacts.cfg means /usr/local/etc/nagios/objects/contacts.cfg.
Configuring Contacts
To receive notifications about the status of hosts and services, you need to provide your contact details. By default, Nagios can send notifications by email, but you can easily write a command to send notifications in any convenient way, such as SMS or Jabber.
Let’s configure the administrator’s contact details. Open objects/contacts.cfg for editing:
define contact{
    use                 generic-contact      ; Имя шаблона, в котором определены умолчательные настройки
    contact_name       adw0rd               ; Никнейм администратора
    alias               Mikhail Andreev      ; Полное имя администратора
    email               info@adw0rd.com      ; Адрес электронной почты
    }
Further down in the same file, add the user “adw0rd” to the group:
define contactgroup{
    contactgroup_name     admins                     ; Имя группы
    alias                   Nagios Administrators      ; Описание группы
    members                 adw0rd, <another_username> ; Список пользователей через запятую
    }
Configuring Hosts
We want to use Nagios to monitor our servers, so first we need to configure the hosts and their groups. Define the local host and a group in objects/localhost.cfg:
define host{
    use                freebsd-server   ; Имя шаблона, в котором определены умолчательные настройки
    host_name          localhost       ; Произвольное имя хоста, можно оставить "localhost",
                                        ; но я обычно меняю на что-то более осмысленное,
                                        ; самое главное не забыть потом всем сервисам указать правильный "host_name",
                                        ; но еще лучше использовать директиву "hostgroups" для сервисов, ниже я так и буду делать
    alias              localhost
    address             127.0.0.1
    }

define hostgroup{
    hostgroup_name  freebsd-servers   ; Имя группы
    alias            FreeBSD Servers   ; Описание группы
    members          localhost        ; Укажите через заяпятую список хостов относящихся к этой группе
    }
Let’s define a couple more hosts, only this time they will be remote (external hosts). To do this, create objects/remotehosts.cfg:
define host{
    use                remote-server
    host_name           RemoteServer1
    address             203.0.113.42
    }

define host{
    use                remote-server
    host_name           RemoteServer2
    address             203.0.113.43
    }

define hostgroup{
    hostgroup_name  remote-servers
    alias             Remote Servers
    members           RemoteServer1, RemoteServer2
    }
After that, you need to tell Nagios about the new configuration file. Add the following code to nagios.cfg:
cfg_file=/usr/local/etc/nagios/objects/remotehosts.cfg
Configuring Services
I always recommend putting hosts into groups and configuring services only for groups. Today you may have one host, but tomorrow you could have dozens or hundreds of similar hosts to monitor, so it’s better to specify “hostgroups” in services instead of “host_name” right from the start.
We’ll define services directly in the host files: objects/localhost.cfg (for the local host) and objects/remotehosts.cfg (for all additional hosts).
Let’s start with the local host (open “objects/localhost.cfg”) and, as an example, look at a service for checking ping:
define service{
    use                     local-service      ; Используем шаблон local-service, определенный в objects/templates.cfg
    hostgroups              freebsd-servers     ; Принадлежность сервиса к группе хостов
    service_description     PING                ; Описание сервиса, в свободной форме
    check_command           check_ping!100.0,20%!500.0,60%    ; Вызываем команду check_ping с аргументами
    notifications_enabled   1                   ; Если "1", то оповещать о изменениях в сервисе, если "0", то нет. По умолчанию "1"
    }
Now let’s configure services for the remote hosts. Add the following to objects/remotehosts.cfg:
define service{
    use                             remote-service     ; Используем шаблон remote-service, определенный в objects/templates.cfg
    hostgroups                      remote-servers      ; Принадлежность сервиса к группе хостов
                                                        ; (сервис будет выполняться на всех хостах относящихся к группе)
    service_description             PING                ; Описание сервиса, в свободной форме
    check_command                   check_ping!100.0,20%!500.0,60%  ; Команда и аргументы
    }
From here, just add the services you need to the file and write your own commands. In principle, you can copy all the network services from objects/localhost.cfg to objects/remotehosts.cfg, since it makes no difference whether you check them locally or remotely (except for hosts behind a firewall, those listening only on internal interfaces, and so on). For services that can only work locally (disk checks, Load Average, and so on), you need to use NRPE, which lets you create commands on remote hosts and run them from the monitoring server.
What Are Commands and Plugins in Nagios?
Let’s continue with our example of calling the check_ping command. As we saw, command arguments are separated by “!”. Now let’s look at the command definition in objects/commands.cfg:
# 'check_ping' command definition
define command{
    command_name    check_ping
    command_line    $USER1$/check_ping -H $HOSTADDRESS$ -w $ARG1$ -c $ARG2$ -p 5
    }
Here,
$USER1$is a user-defined variable declared inresource.cfg, containing the path to the plugins directory$USER1$=/usr/local/libexec/nagios$HOSTADDRESS$is the host address we defined earlier inhost.address;$ARG1$and$ARG2$are the arguments passed to the command.
These and many other variables are called macros. You can read more about them here:
In other words, the command calls the /usr/local/libexec/nagios/check_ping plugin and passes arguments to it. Let’s look at the plugin’s help:
$ /usr/local/libexec/nagios/check_ping
Usage:
check_ping -H <host_address> -w <wrta>,<wpl>% -c <crta>,<cpl>%
 [-p packets] [-t timeout] [-4|-6]
Now it’s clear why the plugin needs these arguments. You can run these plugins manually while writing commands to work out which arguments you need to pass.
I think by now the chain of execution should be clear: Хост -> Сервис -> Команда -> Плагин.
Configuring Templates
When creating the additional hosts and services, we specified that we would use the remote-server and remote-service templates. Now we need to create them. Open objects/templates.cfg for editing:
define host{
    name                       remote-server    ; Имя шаблона
    use                        generic-host     ; Наследуемся от шаблона "generic-host", который определен в этом же файле
    check_period              24x7             ; Проверять хосты в режиме 24 часа, 7 дней в неделю
    check_interval            5                ; Проверять каждые 5 минут
    retry_interval            1                ; Проверять расписание проверки хоста каждую минуту
    max_check_attempts       10               ; Максимальное количество попыток проверки
    check_command             check-host-alive ; Команда для проверки хостов
    notification_period      workhours        ; Оповещать только в рабочие часы (Вы можете указать "24x7" чтобы оповещать всегда)
    notification_interval    60               ; Переотправлять оповещение каждые 60 минут
    notification_options     d,u,r            ; Отправлять только при этих событиях
                                                 ;    (смотрите памятку в начале статьи, вкратце: Down, Unreachable, Recoveries)
    contact_groups            admins           ; Какой группе пользователей отправлять уведомдения
    register                   0                ; Указываем что это просто шаблон и его не надо регистрировать как хост
    }

define service{
    name                      remote-service    ; Имя шаблона для сервисов
    use                       generic-service   ; Наследуемся от шаблона "generic-service", который определен в этом же файле
    max_check_attempts      4                 ; Проверять сервис 4 раза прежде чем убедится в его статусе
    normal_check_interval   5                 ; Проверять сервис каждые 5 минут в нормальном состоянии (когда сервис работает корректно)
    retry_check_interval    1                 ; Перепроверять сервис каждую минут после того как сервис стал работать некорректно
    register                  0                 ; Указываем что это просто шаблон и его не надо регистрировать как сервис
    }
In general, templates serve to define shared logic for entities such as contacts, services, hosts, and so on. This is a very handy tool, and I recommend using it consistently.
Finally, start Nagios:
/usr/local/etc/rc.d/nagios start
If you encounter any errors, leave a comment and I’ll help.
Configuring the Nagios Web Interface
Now let’s configure the web interface, starting with fcgiwrap. Edit /etc/rc.conf:
fcgiwrap_enable="YES"
fcgiwrap_profiles="nagios"
fcgiwrap_nagios_socket="unix:/var/run/fcgiwrap/nagios.socket"
fcgiwrap_nagios_user="www"
Start fcgiwrap:
/usr/local/etc/rc.d/fcgiwrap start
Let’s configure php-fpm. Edit /usr/local/etc/php-fpm.conf; the most important thing is to specify the following settings:
[www]
listen = /var/run/php5/fpm.sock;
user = www
group = www
...
Let’s configure Nginx. Create /usr/local/etc/nginx/sites-available/monitoring.conf:
server {
    listen 80;
    server_name monitoring.example.org;
    root /usr/local/www;
    auth_basic "Password, please!";
    auth_basic_user_file /path/to/htpasswd;

    location /nagios/ {
        index index.html index.php;
    }
    location ~ ^/nagios/.+\.php$ {
        fastcgi_pass unix:/var/run/php5/fpm.sock;
        fastcgi_param SCRIPT_FILENAME $document_root$fastcgi_script_name;
        fastcgi_param QUERY_STRING $query_string;
        include fastcgi_params;
    }
    location ~ ^/nagios/.+\.cgi$ {
        fastcgi_pass unix:/var/run/fcgiwrap/nagios.socket;
        # У нас свой htpasswd файл, в котором нет пользователя "nagiosadmin", но так как мы доверяем своему файлу,
        # то подменяем $remote_user с нашим пользователем на "nagiosadmin" чтобы Nagios не паниковал:
        fastcgi_param AUTH_USER "nagiosadmin";
        fastcgi_param REMOTE_USER "nagiosadmin";
        fastcgi_param SCRIPT_FILENAME $document_root$fastcgi_script_name;
        include fastcgi_params;
    }
}
Don’t forget to generate htpasswd:
# Создаем новый
htpasswd.py -cb /path/to/htpasswd <username> <password>

# Или обновляем существующий
htpasswd.py -b /path/to/htpasswd <username> <password>
On FreeBSD, I use a Python script to generate htpasswd files. You can install it like this:
cd /usr/ports/security/py-htpasswd
make install clean
Now create a symlink and restart Nginx:
ln -s /usr/local/etc/nginx/sites-available/monitoring.conf /usr/local/etc/nginx/sites-enabled/monitoring.conf
nginx -s reload
Now we can see Nagios at http://monitoring.example.org/nagios/
Management Through the Web Interface
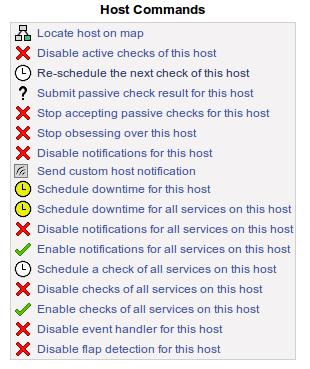
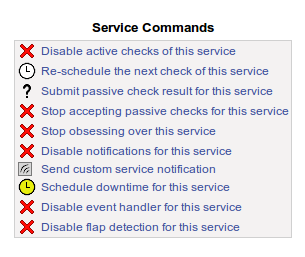
Besides monitoring and displaying system information, we can manage hosts and services: stop notifications, request a “check”, send notifications manually, and so on.
Two screenshots to demonstrate:
Further Reading
Comments are closed. Read the original discussion in Russian →